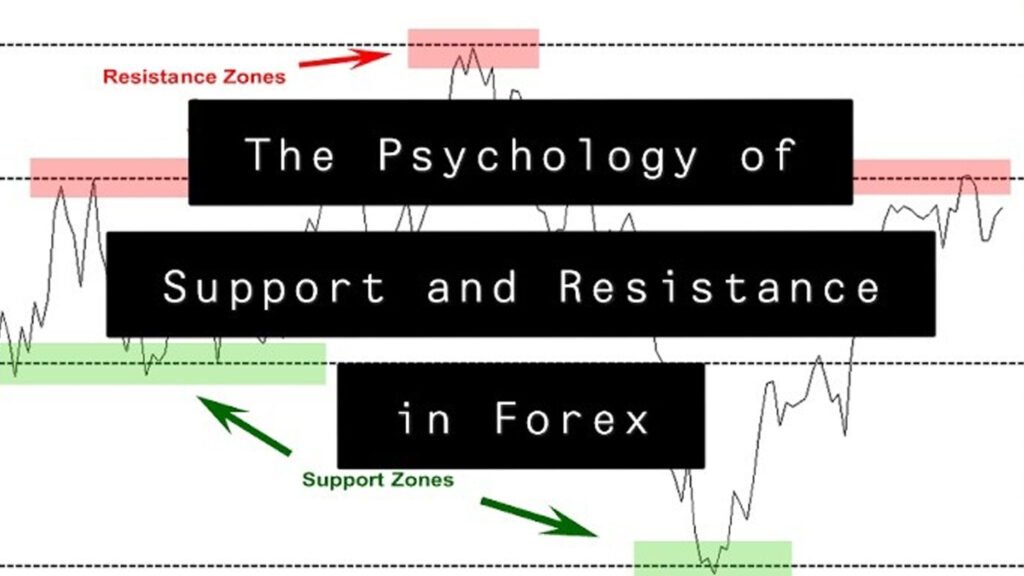
The psychology of support and resistance zone

Technical analysts use support and resistance levels to identify prices on a chart where the odds favour a break, or reversal, of a dominant trend. Support occurs where a downtrend breakout is expected, due to a concentration of demand. the uptrend should stop temporarily, due to the concentration of supply.
These levels, while at first glance they may seem arbitrary, are based on market sentiment and anchoring. Here, we take a look at how areas of support and resistance are largely shaped by human emotions and psychology.
MAIN POINTS TO REMEMBER
- The concepts of support and resistance at the trading level are important price levels on charts that tend to act as barriers, preventing the price of an asset from being pushed into a certain direction.
Market psychology plays an important role as traders and investors remember the past and react to changing conditions to anticipate future market movements.
Changing areas of resistance and support can be revealed by understanding the sentiment and emotions of different market players and how they join the market.
The psychology behind support and resistance
In any given financial market there are generally three types of participants at a given price point:
- 1. Those who are long and wait for the price to rise
- 2. Those who are short and hope that the price will drop by
- 3. Those who have not yet decided how to trade and remain on the sidelines
When the price rises from a support level, long traders are happy and may consider increasing their positions if the price falls back to the same support level. Traders who are short in this situation begin to question their positions and may buy to hedge (exit the position) to exit or approach breakeven if the price hits the support level again.
Traders who have not yet entered the market at this price point may be ready to jump and buy if the price returns to the support level. Essentially, a large number of traders may be eager to buy at this level, increasing its strength as a support area. If all of these participants buy at this level, the price will likely bounce off the support once more.
The price may however drop to the support level. As the price continues to fall, traders will quickly find that the support level is not holding. Long traders can wait for the price to rise to the previous support level, which will now act as resistance, to exit their trades in the hope of limiting losses.
Short traders are now happy and can consider increasing their positions if the price revises the price level. Finally, traders who have not yet entered the market may go short if the price returns to its previous support level, in anticipation of a further fall in price. Again, a lot of traders may be willing to step up to this level, but now instead of buying they will sell. This same behaviour can be seen in reverse with traders’ reactions to resistance levels.
Examples of Scalable Areas
These examples illustrate an important principle of technical analysis: what previously served as support will eventually become resilient. Conversely, the levels that have formed resistance will act as support once the price breaks through the resistance level. It can be seen on any chart or any period. While investors generally refer to daily charts to determine support and resistance areas, shorter time frames are also used, especially by short-term traders, to establish these areas.
Emotions and human behaviour
The fear, greed and instinct of herds are terms that rebel when the psychology of financial market research rebels. During this time, short traders will buy to hedge because they are afraid of losing money. The herd instinct is also demonstrated in this example, as traders tend to congregate near these support and resistance levels, strengthening them further.
Traders can also collectively experience a conditioned response, in a way due to something called anchoring. Anchoring is a heuristic revealed by behavioural finance that describes the unconscious use of irrelevant information, such as the purchase price of a stock, as a point of reference for making subsequent decisions about that stock. Therefore, if a resistance or support level has been established in the past, it may create a shared anchor point where those same levels will meet resistance or support in the future.
Emotional Price Levels
Other support and resistance levels that are affected by human emotions include round numbers (as they are easy to remember), 52-week highs and lows, and historical events such as new highs of the market. Traders and investors tend to look to these psychological price points for several reasons. The first is that these prices have been important in the past and traders know they are likely to be important again. Market participants often assess future expectations based on what has happened in the past; if a support level has worked in the past, the trader can assume that it will provide strong support again.
Another reason emotional price points are important is that they attract a lot of attention and create anticipation, which can lead to an increase in volume as more traders prepare to respond. New market highs, for example, create a buzz of excitement as traders imagine prices rising, with no previous resistance level to slow it down. As the bulls take the lead, the euphoria can lead to a significant surge above the previous high, usually with more market participation, until the excitement wears off and a new level of resistance is established.


