The principles of market psychology underpin each technical indicator, so a good understanding of crowd behaviour is essential to understanding the fundamentals of certain technical indicators. Market psychology is difficult to predict, but several reliable indicators allow traders and investors to better estimate directional changes based on changing sentiment.
Here we take a look at several technical indicators which are determined by the psychology of the market.
HIGHLIGHTS
Selected technical indicators are used by market participants to better understand the psychology and behavior of the market.
This is because price and volume action can be seen as a story of shifts and shifts in feelings such as fear and greed.
Here we take a look at how market psychology informs several of these indicators including MACD, ADX, RoC and Williams% R.
MACD
Moving Average Convergence Divergence (MACD) is simply a tool that measures changes in consensus from bullish to bearish and vice versa. Extending the basic MACD to a deeper level we find the MACDistogram, which is a tool for determining the difference between long-term and short-term value consensus. The measurement tracks the difference between the fast MACD line (short-term consensus) and the slow signal line (long-term consensus).
The Directional System
The Directional System was developed by J. Welles Wilder, Jr., as a means of identifying trends strong enough to be valid and useful indicators for traders. Directional lines are built to determine whether the trends are bullish or bearish – when a positive directional line is above the negative line, bullish traders have greater strength (and a bullish signal is provided).
The reverse situation indicates a bearish. More telling is the Average Directional Indicator (ADX), which increases as the spread between the positive and negative lines increases. As ADX increases, profitable investments get stronger and losers get weaker; in addition, the trend is expected to continue.
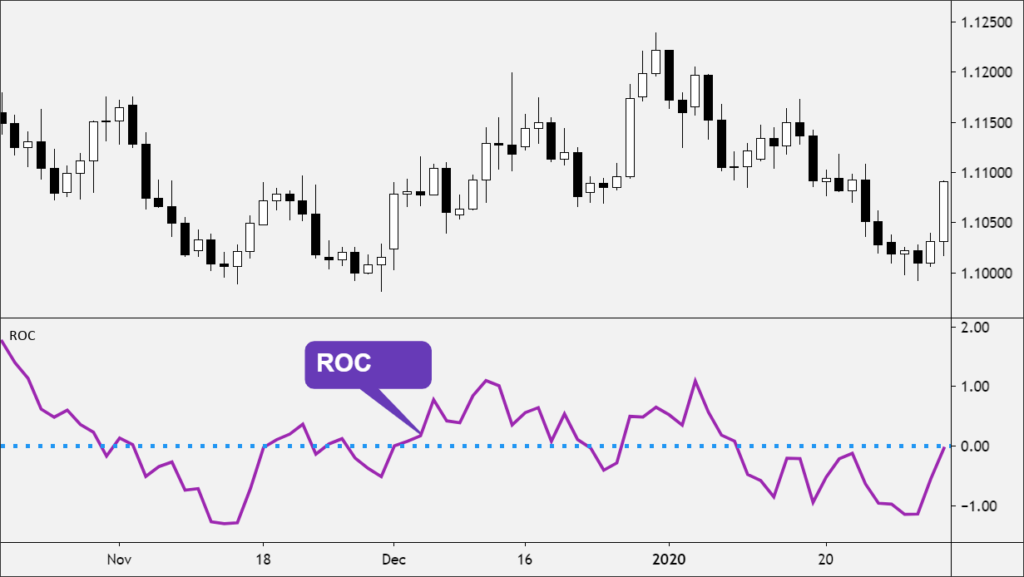
Momentum and Rate of Change (RoC)
Momentum indicators measure changes in the optimism or pessimism of the masses by comparing today’s value (price) consensus with a previous value consensus. Momentum and RoC are specific metrics against which actual prices are compared – when prices increase but momentum or rate of change decreases, a top is likely to be near. If prices reach a new high but momentum or RoC reaches a lower high, a sell signal is issued. These rules also apply in the reverse situation, when prices fall or new lows are reached.
Smoothed Rate of Change
The smoothed rate of change compares today’s exponential moving average (average consensus) with the average consensus of a few points in the past. The smoothed rate of change is simply an improved version of the RoC momentum indicator: it is intended to mitigate the potential error of the RoC in determining the bullish or bearish stance of the market.
Williams% R (Wm% R)
Wm% R, a metric that focuses on closing prices, compares each day’s closing price to a recent consensus range (close price range). If on any given day the bulls can push the market up from its recent range, Wm% R issues a bullish signal and a bearish signal is issued if the bears manage to push the market down its range.
Stochastic
Similar to Wm% R, the Stochastic measures closing prices against a range. If the bulls push the price higher during the day but fail to close near the high end of the range, the stochastic goes down and a sell signal is issued. The same is true if bears push prices down but fail to close near the low, in which case a buy signal is issued.
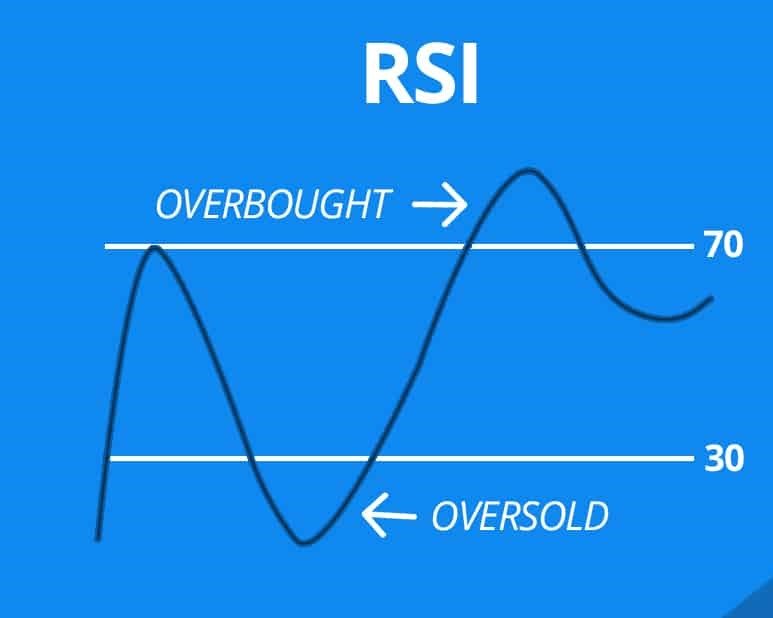
Relative Strength Index (RSI)
The RSI also measures market psychology in a fundamentally similar way to Wm% R. The RSI is almost always measured with a computer, usually over a seven or nine-day interval, giving a numerical result between 0 and 100 indicating situations of oversold or overbought; the RSI, therefore, provides a bullish or bearish signal respectively.
Volume
The total volume of stocks traded is a great way to learn about market psychology. Volume is a measure of the emotional state of investors: while an explosion in volume will cause sudden pain from untimely investments and immediate euphoria for those who have made wise investments, low volume is unlikely to translate into not by a meaningful emotional response.
The longest-lasting trends usually occur when the emotion is weakest. When the volume is moderate and shorts and longs don’t experience the roller coaster of emotion, it can be reasonably expected that the trend will continue until the market emotion changes. In a long-term trend like this, small upward or downward price changes will not precipitate a lot of emotions and even a series of small changes occurring day in and day out (enough to create a major trend and gradual) will generally not generate serious emotional reactions.
In the case of short selling, a market rally can be used to flush out individuals holding short positions, hedge them and subsequently push the market higher. The same principle applies to the downside: when buyers give up and bailout, the downside takes poorer investments with it. At the most fundamental level of the market volume, short and long investors who lose money, which collectively come out of their positions, are the main factors in the significant trend of the volume.