Trading volume is the aggregate measure of the number of securities, that is, stocks or contracts that are traded on a particular trading day.
Volume of trade
What is the volume of trade?
Trading volume is the aggregate measure of the number of securities, that is, stocks or contracts that are traded on a particular trading day. Simply put, it means how many stocks have traded ownership hands between buyers and sellers to execute a trade related to bonds, stocks, options, futures, and different types of commodities. Higher trading volume for particular stocks means there is more liquidity attached; the stock has better order execution and a more open market to connect buyers with sellers.
Example Calculation
Let’s take an example from the New York Stock Exchange to understand the concept. Typically we take a scenario of 3 stocks that are listed on the markets and based on these three we will calculate the trade volume. Suppose the shares are from Apple, AT&T, and Verizon. We assume that the first trader buys 1000 Apple shares and sells 500 Astart shares. They also merchant buy 1000 Astart shares and sells 500 Verizon shares to the first trader. Thus we see the total volume of shares traded on the market
How is trade volume expressed? This trading volume, which is reported on an hourly basis, is defined as estimates. The final figure, which is released at the end of the day, is also called an estimate. The full and final figure for a given day is carried over only to the following day.
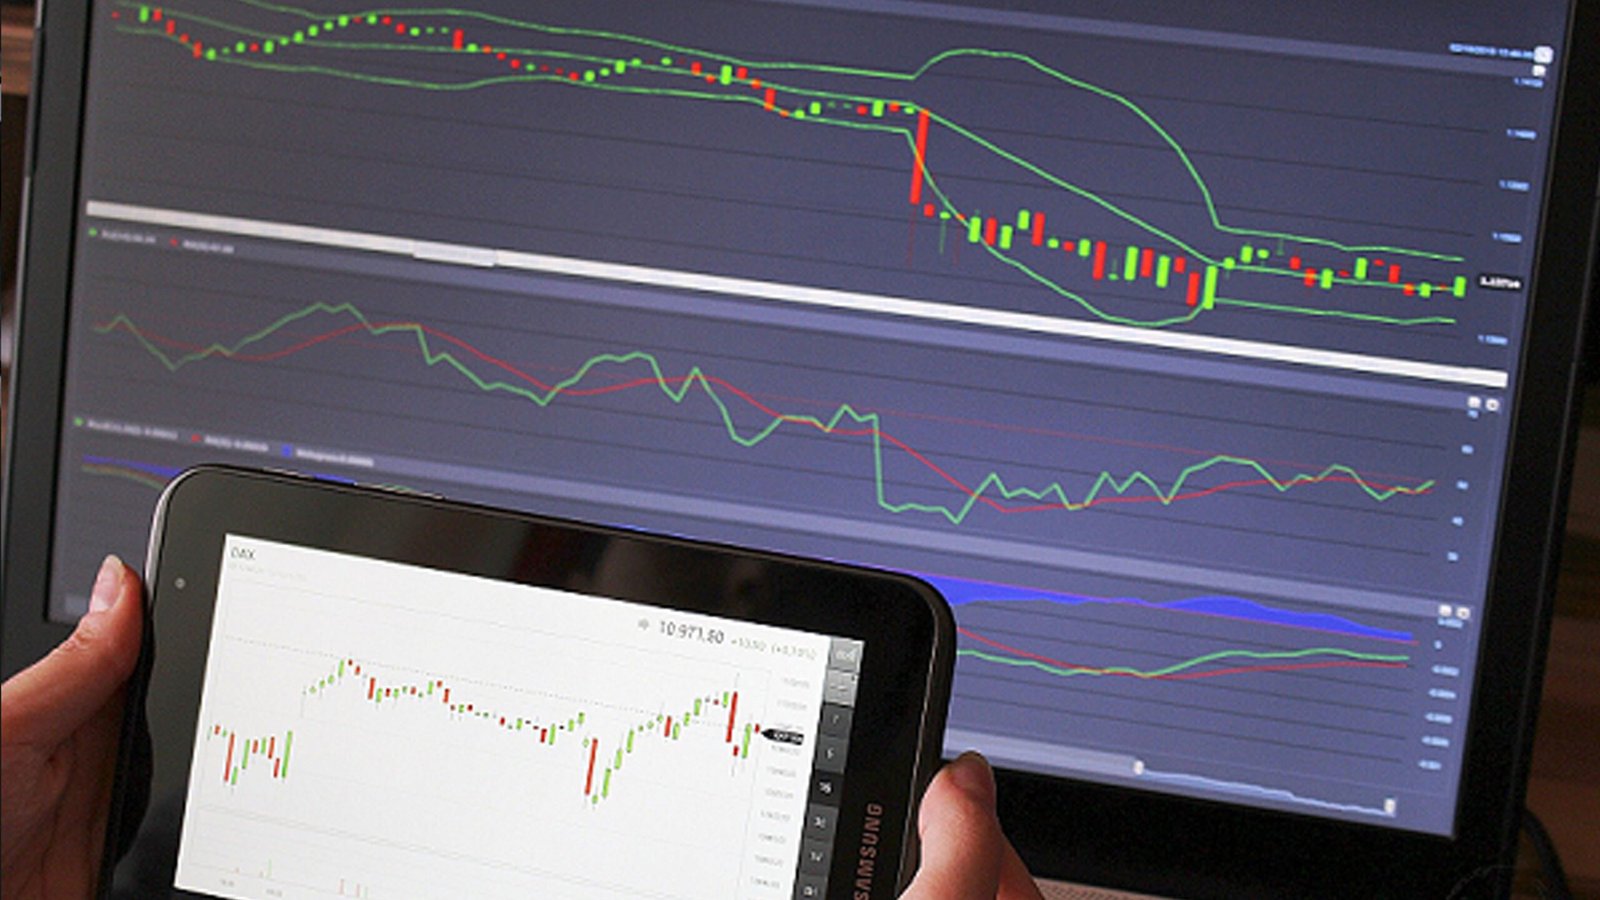
Trade Chart Volume
In trading, volume indicates the number of units that have been traded as a buy or sell of stocks and contracts over a specified period or on a day of trading. stock Exchange. Traders will trust it a lot because it shows the level of liquidity of the asset and the ease with which one can enter or exit the stock or contract. Generally speaking, there are two types of volumes, which are bought volume and sell volume.
When the volume is high, the stock is very easy to buy and sell, and on the other hand, when the volume is low, it is very difficult to buy or sell the stock. For a successful trade to take place, there must be a buyer and a seller. When this is marked on a chart, it is the volume of the trading chart. Typically, it is represented by a bar graph.
Volume bars are usually red or green. A green volume bar means that the contract stock price has risen during the particular trading day and the estimate given on that basis is “Buy” or the stock is considered a volume of purchase. On the other hand, when the colour of the volume bars is red, it means that the price decreased during the trading day, and a volume of sales is estimated according to the same
Trade volume for traders
Trade volume is a very important technical indicator for traders. Traders use it to understand the level of liquidity associated with a particular asset. It also highlights how easy it will be for a trader to enter and exit stocks or contracts depending on the activity level of the asset. It helps traders understand how many interested buyers and sellers are present for a given stock and at what prices the stock or contract can be made or taken out. Hence, it is used as a winning strategy by traders.
Advantage
Indicates the level of liquidity associated with the asset.
Acts as one of the key technical indicators for traders.
Helps traders understand the entry and exit points of a particular asset.
This is a key aspect to take into account when traders opt for intraday trading.
Helps to understand the dynamics of security and to identify a trend
Conclusions
The volume of trade is a very important parameter for trading. The acts as one of the important technical indicators for traders based on which they can decide to participate in a trade or exit a trade.