Trend Analysis

What is Trend Analysis?
Trend analysis is an analysis of the company’s performance by comparing its balance sheets to analyze the market trend or analysis of the future based on the results of past performance and is an attempt to make the best decisions based on the results of the analysis done.
Trend analysis involves collecting information over multiple time periods and tracking the information gathered along the horizontal line with the goal of finding actionable patterns from the information provided. In finance, trend analysis is used for technical analysis and stock accounting analysis.
Types of Trends
A bull market or bull market occurs when financial markets and assets, such as the broader level of the economy, rise and continue to rise in prices of stocks or shares. assets or even the size of the economy over the period. This is a boom time where jobs are being created, the economy is moving towards a positive market, market sentiment is favorable and the investment cycle has begun.
A bear or bear market occurs when financial markets and asset prices, as with the broader level of the economy, decline and stock or asset prices or even the size of the economy continue to decline over time. This is the time when businesses close their doors or reduce production due to a drop in sales. Jobs are being lost and asset prices are starting to fall, market sentiment is not conducive to new investment, investors are rushing to investment heaven.
A lateral / horizontal trend means asset prices or stock prices – as with the higher level of economy – do not move in any direction; Thus the trend analysis in accounting is essential for examining the financial statements for inaccuracies, to see whether the adjustment of the certain heads should be made before the conclusion is drawn from the financial statements.
What is the Use of Trend Analysis?
It is used by both – Accounting analysis and technical analysis.
#1 – Use in Accounting
Sales and cost information of the organization’s profit and loss statement can be arranged on a horizontal line for multiple periods and examined the trends and data inconsistencies. For instance, take the example of a sudden spike in the expenses in a particular quarter followed by a sharp decline in the next period, is an indicator of expenses was booked twice in the first quarter. Thus the trend analysis in accounting is essential for examining the financial statements for inaccuracies, to see whether the adjustment of the certain heads should be made before the conclusion is drawn from the financial statements.
Trend Analysis in accounting compares the overall growth of key financial statement line item over the years from the base case.
#2 – Use in Technical Analysis
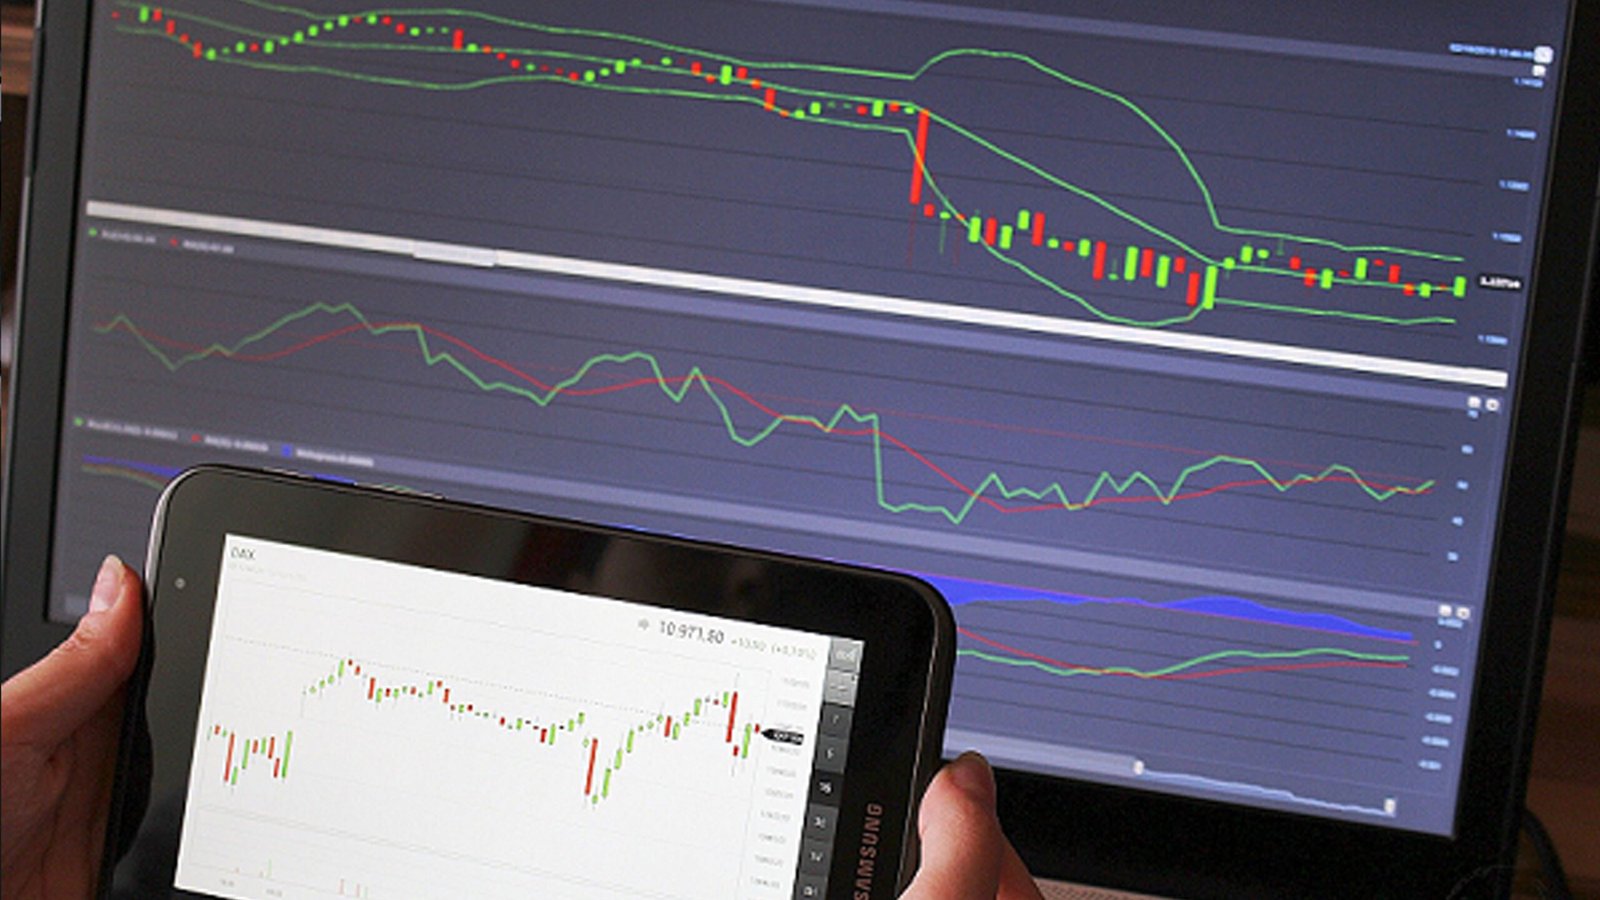
An investor can create his trend line from the historical stock prices, and he can use this information to predict the future movement of the stock price. The trend can be associated with the given information. Cause and effect relationships must be studied before taking concluding the trend analysis.
Trend analysis also involves finding patterns that are occurring over time, like a cup and handle pattern, head and shoulder pattern or reverse head and shoulder pattern.
In technical analysis, it can be used in the foreign exchange market, stock market, or derivative market. With slight changes, the same analysis can be used in all markets.
Trend Analysis Examples
- Examine sales patterns to see if sales are down due to specific customers, products, or sales regions;
- Review of expense report for evidence of fraudulent claims.
- Examination of expense items to determine if there are any unusual expenses during a reporting period that require further investigation;
- Forecast of future income and expense items for budgeting for estimating future results.


Why is trend analysis important?
Trend analysis seeks to discover a trend that is in a market rush and profit from it unless and until the data shows that a trend reversal may occur, such as a market bullish. This is very useful for traders because following the trends, not going against them, will make a profit for an investor. The trend is a trader’s best friend is a well-known quote in the market. A trend is nothing more than the general direction in which the market is heading during a specific period. Trends can be up and down, relating to
bear and bull markets respectively. There is no criteria to decide how long it takes to discover the trend; generally, the longer the steering, the more reliable it is considered. Based on the experience and some empirical analysis, some indicators are designed and the standard time is maintained for indicators such as 14-day moving average, 50-day moving average, 200-day moving average.
Although there is no specified minimum period of time required for a direction to be considered a trend, the longer the direction is held, the more noticeable the trend.
Conclusion
Trend is a friend, it is a well-known quote in the trading fraternity. The trader makes a good profit by following the trend and trend analysis is not an easy task. Attention to detail and an understanding of market dynamics are required.
Trend analysis in accounting can be used by management or analyst to predict future financial statements. Blindly following can be dangerous if a proper analysis of the past event is not made.


